 Close
Close
We Make Data Analytics User- friendly for Everyone
We help people to identify historical, current and predictive views of business operations.Our BI team has excellent skill set in Dashboarding/Data Visualization concepts and can provide you with the right solution based on your business needs.
Power BI
Create reports and dashboards with ease :
Our Power BI team guides you to create reports and dashboards by yourselves, without having to depend on information technology staff or database administrators.
Using this Power BI you can perform data preparation, data discovery and create interactive dashboards.

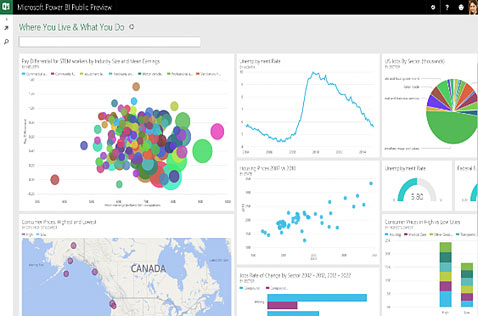
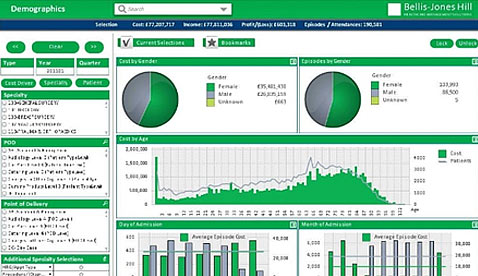
Presents your data using interactive dashboards.
Highlights, filters and combines different views of your data, to help you make decisions.
Sets-up automatic data refresh and publishes reports by allowing all the users to avail the latest information.
In-memory analysis technology and DAX scripting language are both exquisite examples of a balance between simplicity and performance.
We Make Data Analytics User- friendly for Everyone
We help people to identify historical, current and predictive views of business operations.Our BI team has excellent skill set in Dashboarding/Data Visualization concepts and can provide you with the right solution based on your business needs.
Tableau
Explore interactive dashboards on the go :
Our Tableau expert team provides the perfect solution to explore the interactive dashboards in web browsers or mobile devices with the same appealing experience.
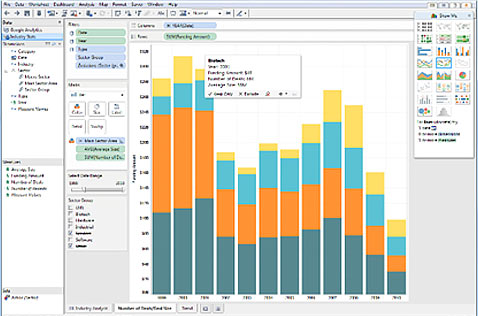
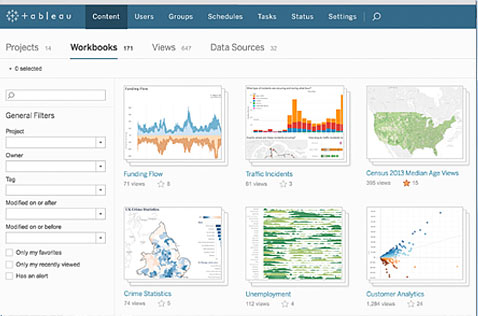
Supports complex computations, data blending and dashboarding for the purpose of creating beautiful visualizations.
Delivers insights that cannot easily be derived from a spreadsheet.
Easy to learn without having prior knowledge of coding.
Creation of various types of visualizations through large amount of data without impacting the performance of the dashboards.
We Make Data Analytics User- friendly for Everyone
We help people to identify historical, current and predictive views of business operations.Our BI team has excellent skill set in Dashboarding/Data Visualization concepts and can provide you with the right solution based on your business needs.
Qlik View/Sense
Perform accurate application data analysis :
Our Qlik view team provides the solution to consolidate, search, visualize and analyze all your data sources for your business needs.
Through this, you will be able to perform application data analysis easily and make accurate decisions.
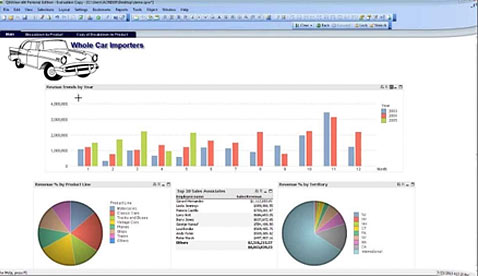
Provides access to various types of data as a single application, thereby enabling management to easily conclude new insights.
Enables quick data interpretation with visual and dynamic dashboards, apps and statistics.
Easy to implement and requires little maintenance time.
Complies with strict security standards ensuring that the business-critical data is always protected.
We Make Data Analytics User- friendly for Everyone
We help people to identify historical, current and predictive views of business operations.Our BI team has excellent skill set in Dashboarding/Data Visualization concepts and can provide you with the right solution based on your business needs.
Open Source
Overview :
Delfers team assists with Open Source Solutions like Portals, Content and Big Data. We work closely with our clients to address their strategic technology challenges and business requirements. We boast of a higher level of expertise in Open Source technology. Through this, Delfers delivers custom-made solutions helping organizations solve their strategic needs, optimize infrastructure productivity and increase business momentum.
Its ability to serve as a localised solution for data privacy, commercially backed open-source programmes also provides a range of other benefits to businesses. This includes greater quality, fewer bugs, increased flexibility, customization and - quite often - significantly reduced costs.
Dependable and robust development architecture.
Customization through innumerable plug and play modules.
Free of vendor lock-ins.
User friendly interface.
Quick turnaround time for solution deployment.